Charts
To create a chart, use createChartShape method of Slide.
<?php

$chartShape = $slide->createChartShape();
Customization
Manage how blank values are displayed
You can define how blank values are displayed with the method setDisplayBlankAs.
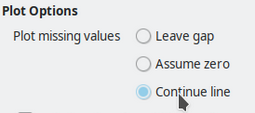
Differents types are available:
Chart::BLANKAS_GAPfor Leave a gapChart::BLANKAS_ZEROfor Assume zero (default)Chart::BLANKAS_SPANfor Continue line
<?php

use PhpOffice\PhpPresentation\Shape\Chart;

// Set the behavior
$chart->setDisplayBlankAs(Chart::BLANKAS_GAP);
// Get the behavior
echo $chart->getDisplayBlankAs();
Parts
Axis
Title
You can define title for each axis (X & Y) with setTitle method.
You can apply a rotation with the setTitleRotation method with an expected paremeter in degrees.
<?php

use PhpOffice\PhpPresentation\Shape\Chart\Gridlines;

$line = new Line();

$shape = $slide->createChartShape();
$shape->getPlotArea()->setType($line);

$shape->getPlotArea()->getAxisX()->setTitle('Axis X');
$shape->getPlotArea()->getAxisX()->setTitleRotation(45);
Gridlines
You can define gridlines (minor and major) for each axis (X & Y). For each gridline, you can custom the width (in points), the fill type and the fill color.
<?php

use PhpOffice\PhpPresentation\Shape\Chart\Gridlines;

$line = new Line();

$gridlines = new Gridlines();
$gridlines->getOutline()->setWidth(10);
$gridlines->getOutline()->getFill()->setFillType(Fill::FILL_SOLID)->setStartColor(new Color(Color::COLOR_BLUE));

$shape = $slide->createChartShape();
$shape->getPlotArea()->setType($line);
$shape->getPlotArea()->getAxisX()->setMajorGridlines($gridlines);
Bounds (Min & Max)
For Axis, you can define the min & max bounds with setMinBounds & setMaxBounds methods.
For resetting them, you pass null as parameter to these methods.
<?php

use PhpOffice\PhpPresentation\Shape\Chart\Gridlines;

$line = new Line();

$shape = $slide->createChartShape();
$shape->getPlotArea()->setType($line);
$shape->getPlotArea()->getAxisX()->setMinBounds(0);
$shape->getPlotArea()->getAxisX()->setMaxBounds(200);
Crossing
Warning
Available only on the PowerPoint2007 Writer
For Axis, setCrossesAt can be used to define where it should be crossed by the perpendicular/ horizontal axis.
The property can be defined by one of the three given constants or as an absolute value on the target axis.
use PhpOffice\PhpPresentation\Shape\Axis;
use PhpOffice\PhpPresentation\Shape\Chart\Type\Bar;

$bar = new Bar();

$shape = $slide->createChartShape();
$shape->getPlotArea()->setType($bar);

// Usage of constant: Horizontal axis will cross the Y-Axis at `0`
$shape->getPlotArea()->getAxisY()->setCrossesAt(Axis::CROSSES_AUTO);

// Usage of individual value: Horizontal axis will cross the Y-Axis at `3`
$shape->getPlotArea()->getAxisY()->setCrossesAt('3');
| Constant | Description |
|---|---|
AXIS::CROSSES_AUTO |
Axis crosses at zero. |
AXIS::CROSSES_MIN |
Axis crosses at minimum. |
AXIS::CROSSES_MAX |
Axis crosses at maximum. |
Reversed Order
You can reverse the order of a categorial or value axis trought setIsReversedOrder.
Notice: If you reverse the order of a axis, this automatically changes the position of the other axis.
To reset this effect, the axis intersection point on the other axis must be set to Axis::CROSSES_MAX using setCrossesAt.
use PhpOffice\PhpPresentation\Shape\Axis;
use PhpOffice\PhpPresentation\Shape\Chart\Type\Bar;

$bar = new Bar();

$shape = $slide->createChartShape();
$shape->getPlotArea()->setType($bar);

// default value, will return false
$shape->getPlotArea()->getAxisY()->isReversedOrder()

// reverse order
$shape->getPlotArea()->getAxisY()->setIsReversedOrder(true);

// revert the automatic intersection switch on x axis
$shape->getPlotArea()->getAxisX()->setCrossesAt(Axis::CROSSES_MAX);
Outline
You can define outline for each axis (X & Y).
<?php

$line = new Line();

$shape = $slide->createChartShape();
$shape->getPlotArea()->setType($line);
$shape->getPlotArea()->getAxisX()->getOutline()->setWidth(10);
$shape->getPlotArea()->getAxisX()->getOutline()->getFill()->setFillType(Fill::FILL_SOLID)->setStartColor(new Color(Color::COLOR_BLUE));
Tick Label
Position
You can define the tick label position with the setTickLabelPosition method.
For resetting it, you pass Axis::TICK_LABEL_POSITION_NEXT_TO as parameter to this method.
Differents types are available:
Axis::TICK_LABEL_POSITION_HIGH: Labels are at the high end of the perpendicular axisAxis::TICK_LABEL_POSITION_LOW: Labels are at the low end of the perpendicular axisAxis::TICK_LABEL_POSITION_NEXT_TO: Labels are next to the axis (default)
<?php

use PhpOffice\PhpPresentation\Shape\Chart\Axis;

$line = new Line();

$shape = $slide->createChartShape();
$shape->getPlotArea()->setType($line);
$shape->getPlotArea()->getAxisY()->setTickLabelPosition(Axis::TICK_LABEL_POSITION_LOW);
Font
You can define the tick label font with the setTickLabelFont method.
For resetting it, you pass null as parameter to this method.
<?php

use PhpOffice\PhpPresentation\Shape\Chart\Axis;
use PhpOffice\PhpPresentation\Style\Color;
use PhpOffice\PhpPresentation\Style\Font;

$line = new Line();
$font = new Font();
$font->setColor(new Color('C00000'))

$shape = $slide->createChartShape();
$shape->getPlotArea()->setType($line);
$shape->getPlotArea()->getAxisY()->setTickLabelFont($font);
Tick Marks
For Axis Y, you can define tick mark with setMinorTickMark & setMajorTickMark methods.
For resetting them, you pass Axis::TICK_MARK_NONE as parameter to these methods.
<?php

use PhpOffice\PhpPresentation\Shape\Chart\Axis;

$line = new Line();

$shape = $slide->createChartShape();
$shape->getPlotArea()->setType($line);
$shape->getPlotArea()->getAxisY()->setMinorTickMark(Axis::TICK_MARK_NONE);
$shape->getPlotArea()->getAxisY()->setMajorTickMark(Axis::TICK_MARK_INSIDE);
Unit
For Axis Y, you can define unit with setMinorUnit & setMajorUnit methods.
For resetting them, you pass null as parameter to these methods.
<?php

use PhpOffice\PhpPresentation\Shape\Chart\Axis;

$line = new Line();

$shape = $slide->createChartShape();
$shape->getPlotArea()->setType($line);
$shape->getPlotArea()->getAxisY()->setMinorUnit(null);
$shape->getPlotArea()->getAxisY()->setMajorUnit(0.05);
Visibility
You can define visibility for each axis (X & Y).
<?php

$line = new Line();

$shape = $slide->createChartShape();
$shape->getPlotArea()->setType($line);
$shape->getPlotArea()->getAxisX()->setIsVisible(false);
Title
By default, the title of a chart is displayed. For hiding it, you define its visibility to false.
<?php

$line = new Line();
$shape = $slide->createChartShape();
$shape->getPlotArea()->setType($line);
// Hide the title
$shape->getTitle()->setVisible(false);
Series
Display Informations
You can define if some informations are displayed.
<?php

$series = new Series('Downloads', $seriesData);
$series->setSeparator(';');
$series->setShowCategoryName(true);
$series->setShowLeaderLines(true);
$series->setShowLegendKey(true);
$series->setShowPercentage(true);
$series->setShowSeriesName(true);
$series->setShowValue(true);
Font
You can custom the font of a serie.
<?php

$series = new Series('Downloads', $seriesData);
// Define the size
$series->getFont()->setSize(25);
Label Position
You can define the position of the data label. Each position is described in MSDN.
<?php

$series = new Series('Downloads', $seriesData);
$series->setLabelPosition(Series::LABEL_INSIDEEND);
Marker
You can custom the marker of a serie, for Line & Scatter charts.
Customize the border
Warning
Available only on the PowerPoint2007 Writer
<?php

use PhpOffice\PhpPresentation\Shape\Chart\Marker;
use PhpOffice\PhpPresentation\Style\Border;

$series = new Series('Downloads', $seriesData);
$marker = $series->getMarker();
$marker->getBorder()->setLineStyle(Border::LINE_SINGLE);
Customize the fill
Warning
Available only on the PowerPoint2007 Writer
<?php

use PhpOffice\PhpPresentation\Shape\Chart\Marker;
use PhpOffice\PhpPresentation\Style\Fill;

$series = new Series('Downloads', $seriesData);
$marker = $series->getMarker();
$marker->getFill()->setFillType(Fill::FILL_SOLID);
Customize the symbol
<?php

use PhpOffice\PhpPresentation\Shape\Chart\Marker;

$series = new Series('Downloads', $seriesData);
$marker = $series->getMarker();
$marker->setSymbol(Marker::SYMBOL_DASH)->setSize(10);
Outline
You can custom the line of a serie, for Line & Scatter charts.
<?php

use PhpOffice\PhpPresentation\Style\Outline;

$outline = new Outline();
// Define the color
$outline->getFill()->setFillType(Fill::FILL_SOLID);
$outline->getFill()->setStartColor(new Color(Color::COLOR_YELLOW));
// Define the width (in points)
$outline->setWidth(2);

$series = new Series('Downloads', $seriesData);
$series->setOutline($outline);
View3D
For enabling the autoscale for a shape, you must reset the height percent.
<?php

$shape->getView3D()->setHeightPercent(null);
Types
Area
TODO
Bar & Bar3D
Gap Width
You can define the gap width between bar or columns clusters. It is relatively defined as percentage of a bars width. The default value is 150%. The value must be defined between 0 and 500.
<?php

$barChart = new Bar();
$barChart->setGapWidthPercent(250);
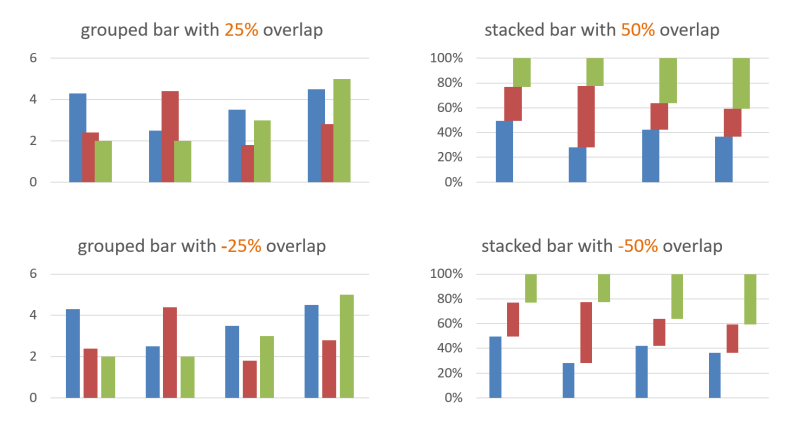
Overlap
You can define the bar overlap within bar or column clusters. It is relatively defined as percentage of a bars width.
The default value is 100% for stacked and 0% for grouped bar charts. The value must be defined between -100 and 100.
When setting the bar grouping type, the default overlap values will be set. Any change to the overlap must be made after setting the bar grouping type through setBarGrouping.
$barChart = new Bar();
// will set the overlap to the default value for grouped bars: 0
$barChart->setBarGrouping(Bar::GROUPING_CLUSTERED);

// a positive value will result in an overlapping
$barChart->setOverlapWidthPercent(25);

// a negative value will result in a gap
$barChart->setOverlapWidthPercent(-25);
Stacking
You can stack multiples series in a same chart. After adding multiples series, you can define the bar grouping with setBarGrouping method of AbstractTypeBar.
<?php

$barChart = new Bar();
$barChart->addSeries($series1);
$barChart->addSeries($series2);
$barChart->addSeries($series3);
$barChart->setBarGrouping(Bar::GROUPING_CLUSTERED);
// OR
$barChart->setBarGrouping(Bar::GROUPING_STACKED);
// OR
$barChart->setBarGrouping(Bar::GROUPING_PERCENTSTACKED);
| Type | Constant | |
|---|---|---|
 |
Grouped Bars | Bar::GROUPING_CLUSTERED |
 |
Stacked Bars | Bar::GROUPING_STACKED |
 |
Stacked Bars 100% | Bar::GROUPING_PERCENTSTACKED |
Line
Smooth line
You can enable or disable the smooth line with setIsSmooth method from AbstractTypeLine.
By default, smooth line is disabled.
<?php

$chart = new Line();
// Enable the smooth line
$chart->setIsSmooth(true);
// Disable the smooth line
$chart->setIsSmooth(false);
// Get status of smooth line
$chart->isSmooth();
Pie & Pie3D
TODO
Radar
You can create a Radar Chart.
<?php

use PhpOffice\PhpPresentation\Shape\Chart\Type\Radar;

$radarChart = new Radar();

$shape = $slide->createChartShape();
$shape->getPlotArea()->setType($radarChart);
Scatter
Smooth line
You can enable or disable the smooth line with setIsSmooth method from AbstractTypeLine.
By default, smooth line is disabled.
<?php

$chart = new Scatter();
// Enable the smooth line
$chart->setIsSmooth(true);
// Disable the smooth line
$chart->setIsSmooth(false);
// Get status of smooth line
$chart->isSmooth();